
What this board answers
Where does every location stand against the goal you set, and what does each one still need to sell per day to get there? It is the Monday-morning board for managers and owners: the weekly tracker most studios keep by hand, filled from the same numbers the rest of Xyzios uses. Where a definition differs from a spreadsheet you are used to, the row says so.
How to read it
The tabs at the top pick the window: WTD, MTD, QTD, YTD, Last 30d, Last qtr and Last 12mo (hover for the full name). Only windows the studio can answer appear.
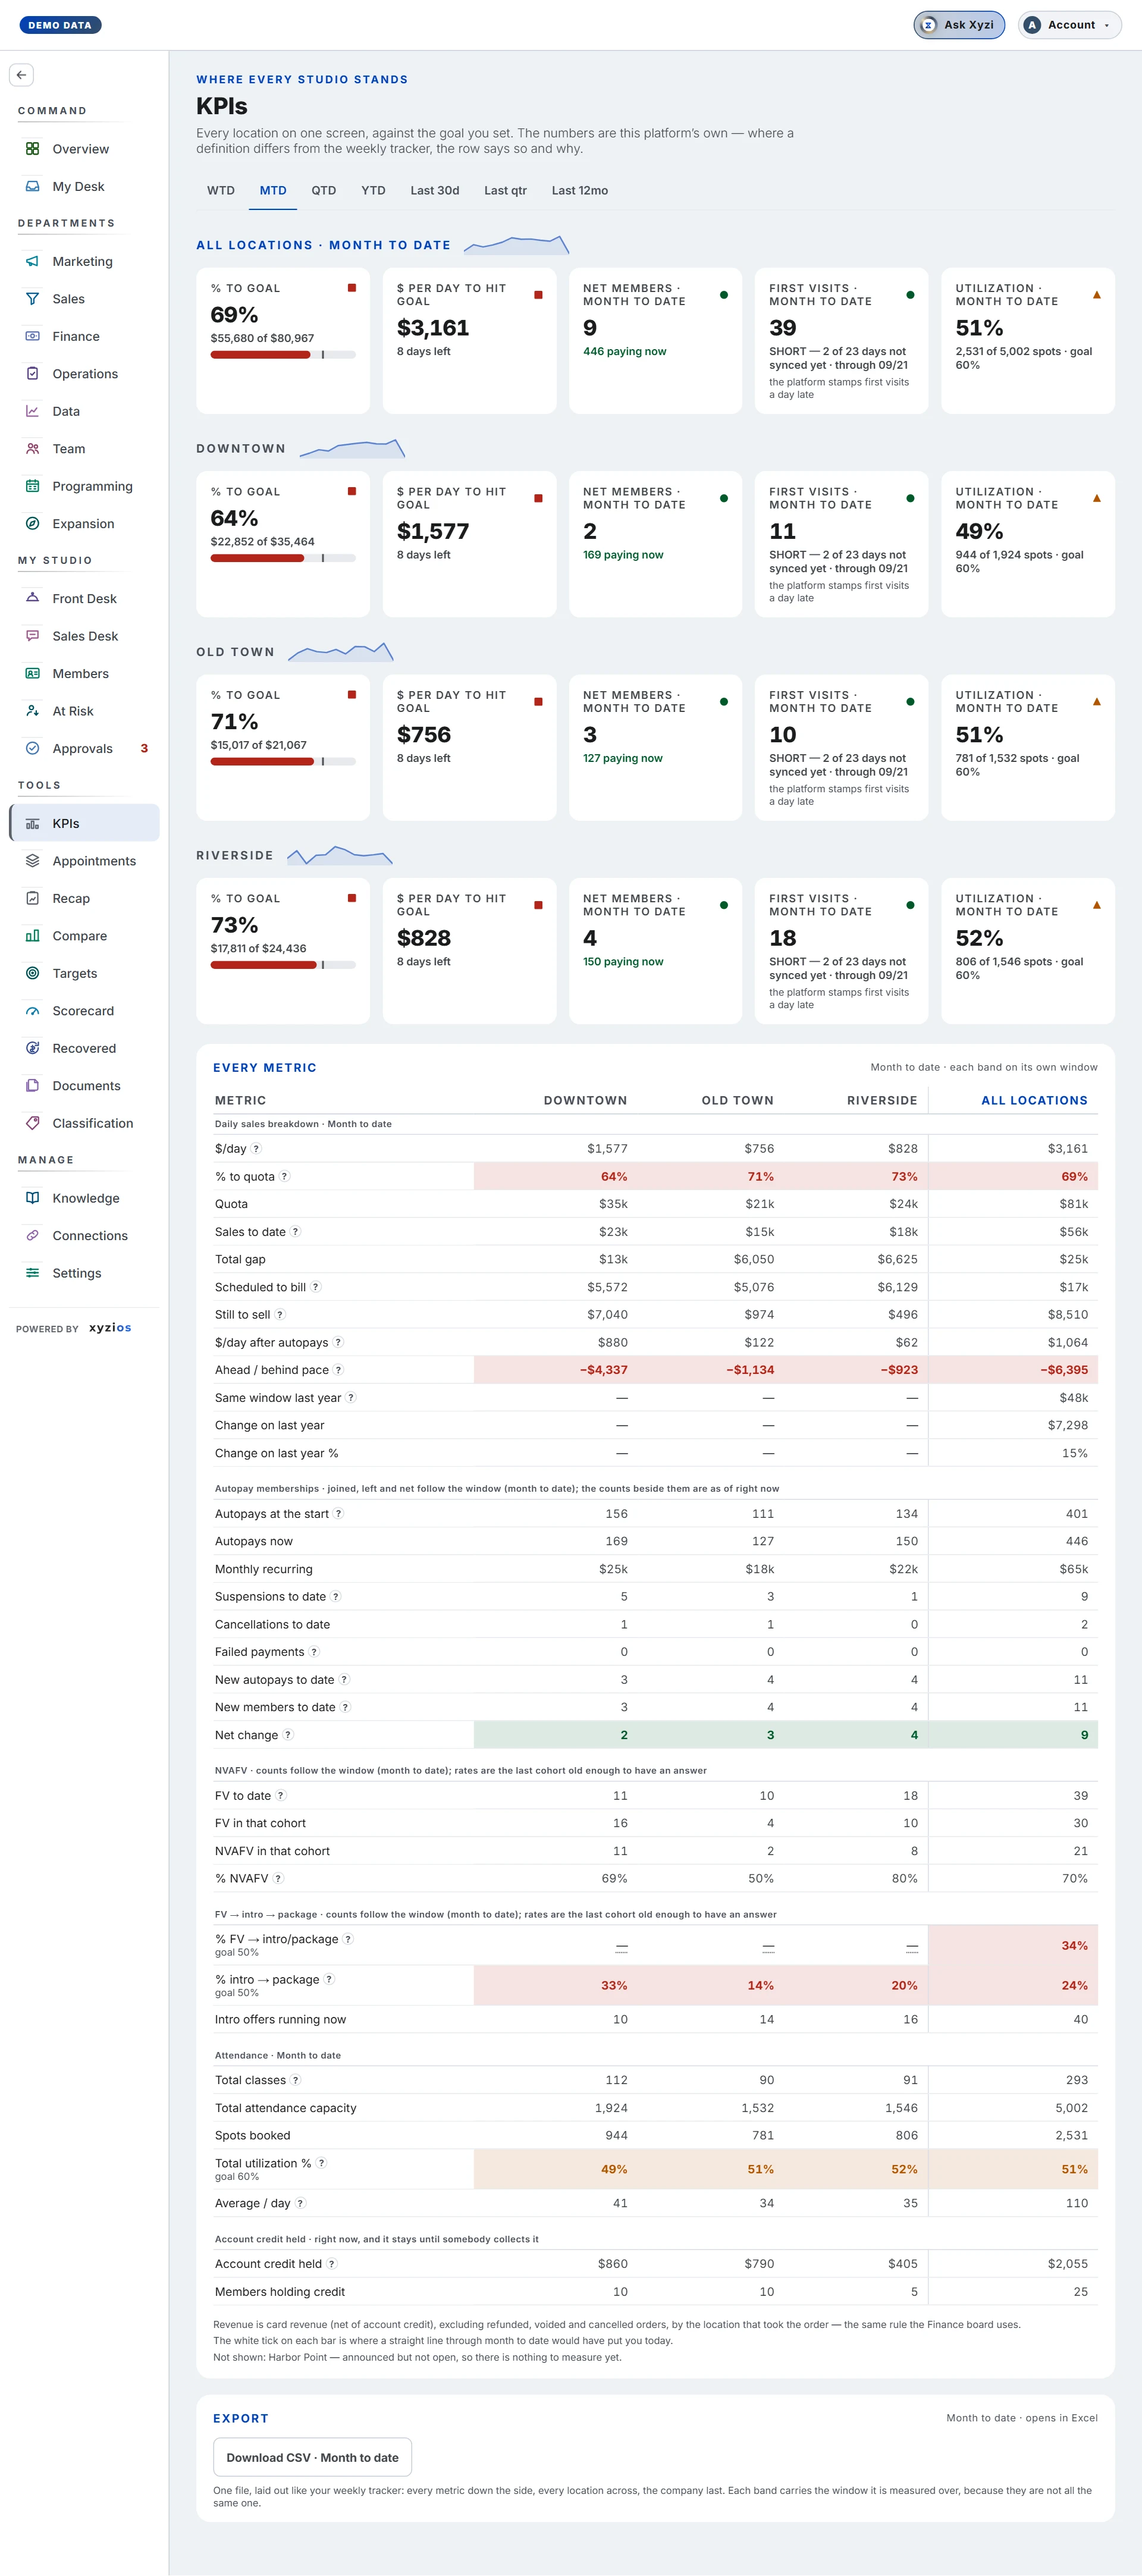
Then one band per scope. All locations, with the window in its heading, comes first, then a band per open location. A single-location studio sees one band under its own name. Each band has a 12-month revenue trend beside its heading and five tiles:
- 1% to goal: revenue taken against the quota for the window. The bar fills with progress; the white tick is where a straight line through the window would have put you today.
- 2$ per day to hit goal: the gap divided by the days still left. Reads Goal met once the quota is reached and No daily rate on Last 30 days, which has no end to sell towards.
- 3Net members, over the window: new autopays less cancellations, with the number paying now beneath.
- 4First visits, over the window.
- 5Utilization, over the window: spots booked of spots offered.
6Every metric is the full grid beneath: one row per metric, one column per location, the company last. Rows sit in bands that each name their own window. Daily sales breakdown and Attendance follow the tabs. Autopay memberships mixes movements that follow the window with balances as of right now. NVAFV and FV → intro → package are cohorts: counts follow the window, rates come from the last cohort old enough to have an answer. Account credit held is as of today.
A ? beside a row label explains how that number is defined and where it differs from a typical tracker. A goal under a label is what the cell colours judge against: green on goal, amber close, red off. A blank cell with a dotted underline carries its reason on hover; a row blank everywhere says why under its label.
If you manage one location you see only your own sites, with no All locations band and no company column.
What to do here
The board is read-only.
- Pick the window. A closed window (Last qtr, Last 12mo) shows what was made against the plan and no daily rate. Week to date and Last 30 days share the monthly plan evenly across their days; the note above the grid says so.
- Read the tiles first. $ per day to hit goal is the one number here that is an instruction rather than a reading.
- Drop to the grid when you want the row behind a tile.
- Download CSV, named with the window, at the bottom hands you the grid laid out like a weekly tracker.
- To change the goal a location is measured against, go to Targets. The fill goal is set by your owner.
Common questions
Why is my number different from our tracker?
Xyzios counts new members as people, not memberships sold. Net change is new autopays less cancellations and does not subtract failed payments, since a decline that becomes a cancellation would be counted twice. Sales to date is money actually taken, with no autopays still to bill added on. Every such row has a ? with the detail.
Why is a whole row blank?
Usually a setting, not a fault. % FV → intro/package stays blank until a product counts as a first visit on Classification. Failed payments reads blank on Mindbody, which reports no failed payment back. Suspensions to date is a live count of people paused right now on every platform; Mindbody shares that a membership is suspended but not when, so there is no paused-this-month figure there. Same window last year is blank when Xyzios does not hold your data that far back.
Why does the company column not equal my locations added up?
Some members and orders carry no location in the booking platform, an online store for instance. They belong to the company and to no site.
Is Account credit held money we are owed?
No. It is money members have paid in and not yet spent. A tracker’s “negative account balance” is a different figure that neither platform exposes.
Why do the tabs not move the NVAFV rates?
A return rate needs a cohort old enough to have come back. Read off the open month it would show every studio losing most of its first-timers, every month.