
What this board answers
What did we sell, and what did we earn and spend by the books? Two lanes, one window. Sales is the booking platform, live to today. Books is your P&L, by closed month, and it is the management view; your bookkeeper still owns the official books.
How to read it
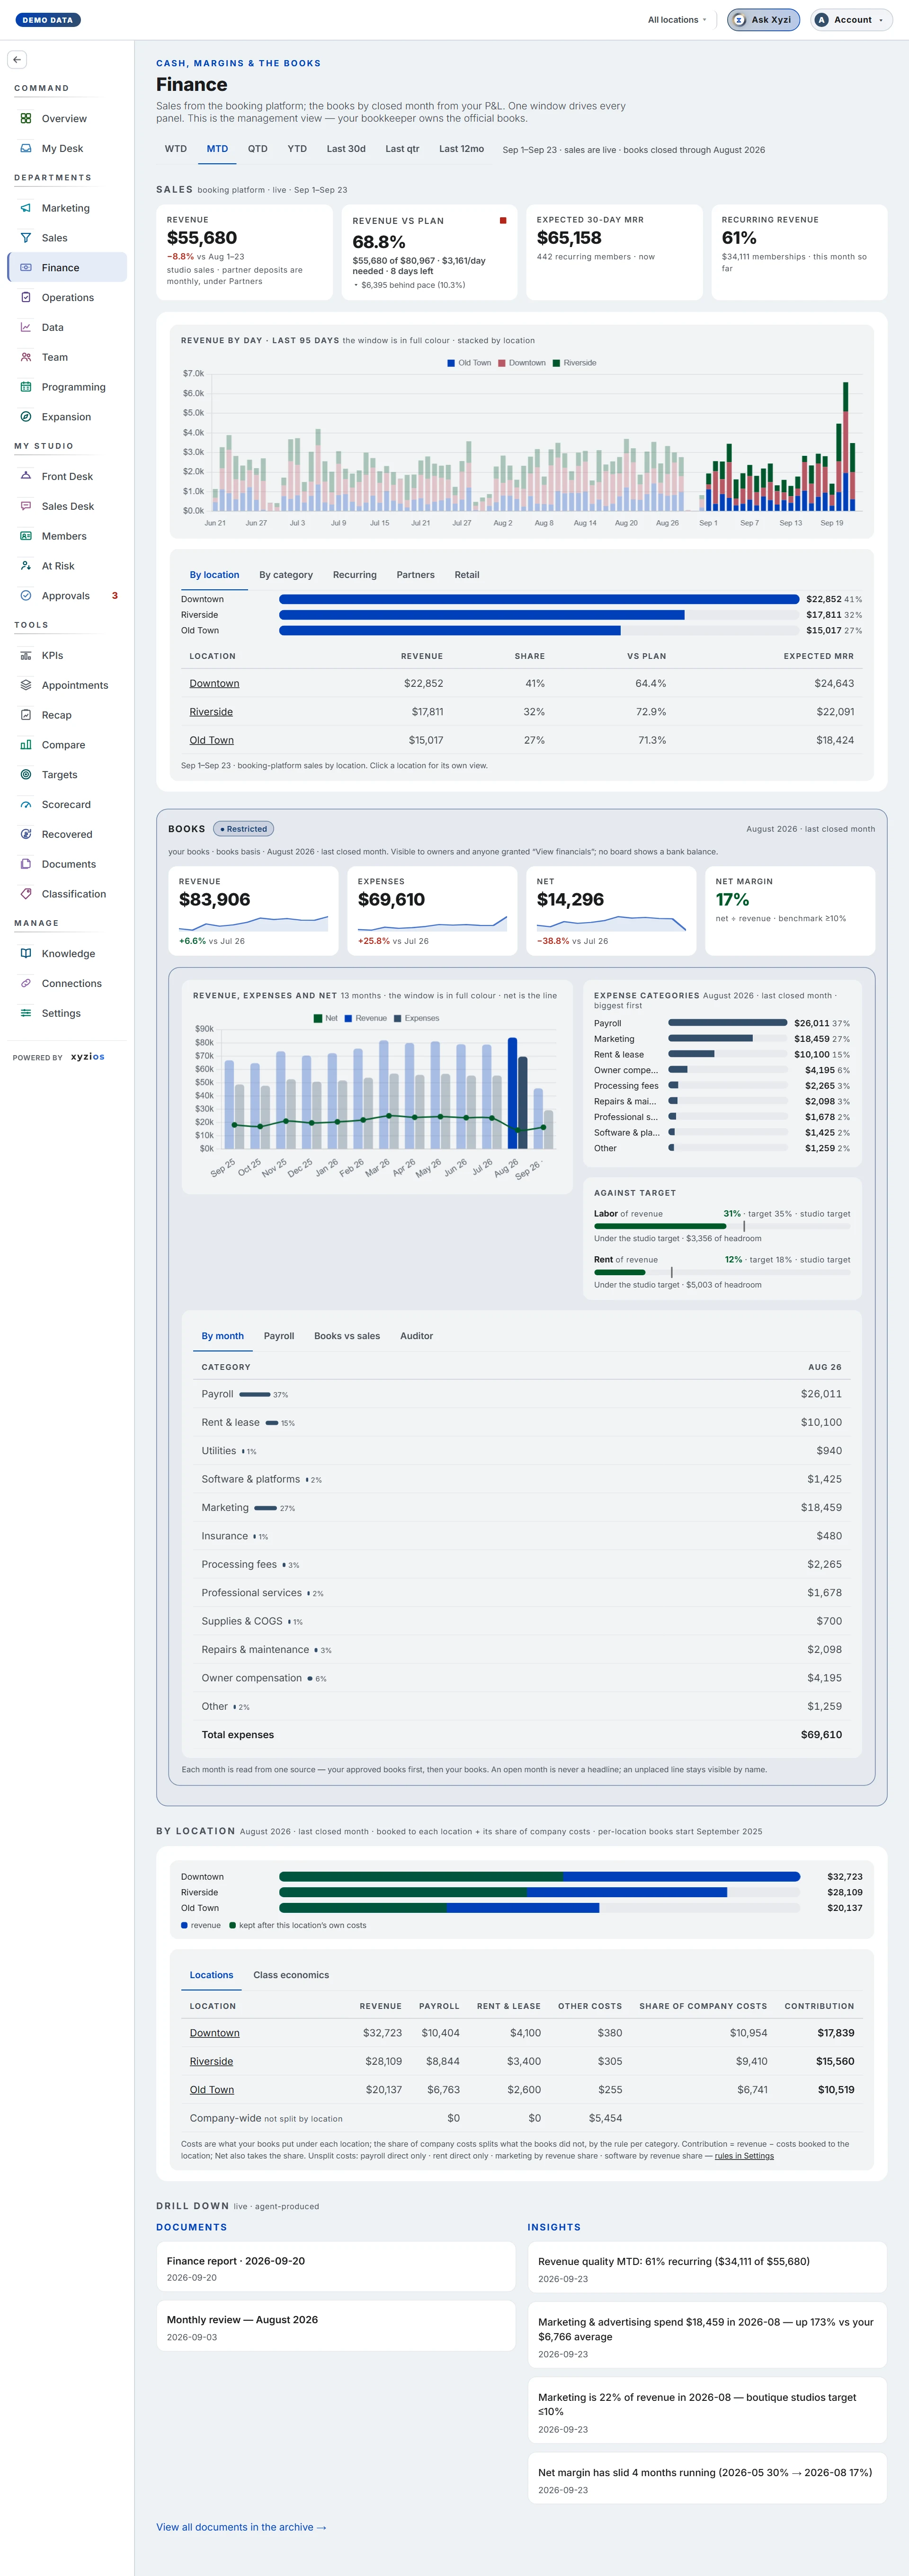
The window tabs (WTD, MTD, QTD, YTD, Last 30d, Last qtr, Last 12mo) drive every panel. The caption beside them resolves the two lanes, for example “Sep 1–4 · sales are live · books closed through August”. On a live window the Books lane shows the last closed month, never a part month.
Sales cards: 1Revenue (with what it is built from), 2Revenue vs plan where a plan exists, Expected 30-day MRR from active memberships, and Recurring revenue as a share of sales. On a location tab Share of company replaces it. The chart is revenue by day for short windows and by month for long ones, stacked by location, with the window in full colour and partner deposits as their own segment.
Sales tabs: 3By location (revenue, share, vs plan, expected MRR; tap a row for that site), By category (memberships, intros, drop-ins and the rest, comps excluded), Recurring, Partners (ClassPass and Wellhub deposits, revenue the booking platform cannot see) and Retail.
4Books is marked ● Restricted: owners see it, and anyone the owner grants View financials in My Team. Its cards are Revenue, Expenses, Net and Net margin, compared with the same-length window before. The chart is revenue, expenses and net over 13 months. 5Expense categories ranks spend biggest first; 6Against target grades Labor and Rent as a share of revenue. Tabs: By month (the category matrix, with a Needs a category row when the books name a line nobody has placed), Payroll (wages by group, never by person), Books vs sales (the same month from the books and from the platform, with the gap) and Auditor (rule-based flags and benchmarks: labor ≤45%, rent ≤20%, marketing ≤12%, net ≥10%, plus spikes and books-vs-bank drift). A month the bookkeeper has not closed is shown as held.
On a location tab, Books · site shows Revenue, Payroll, Rent & lease and Net, where costs are what the books put under that site plus its share of company costs, each figure saying which. Tabs add Class economics: revenue and cost per class and per attendee. This section needs the See location costs grant; without it the board says so.
The same grant puts an est. break-even on Programming and Operations: payroll plus rent from these books, over classes run in the last three closed months, turned into the attended heads a class needs. Held and open months are left out, owner pay is never in it, and a Location Manager sees their own sites’ figure only, never the company-wide one.
A Location Manager sees Finance for their sites only: Sales for those rooms, and never the company Books. No board shows a bank balance, by design.
On a location tab, Drill down lists only the documents and insights about that site; the company’s stay on All locations.
What to do here
- Pick the window, then read the caption so you know which months the Books lane is standing on.
- In Sales › By location, tap a site to open its own view.
- If a banner says expenses have no category, go to Settings › Expense categories and place them; every share below is understated until you do.
- Open Books vs sales monthly. A few percent of gap is timing and fees; past 10% is a question for your bookkeeper.
- Read Auditor for flags, then take them to the Recap or your bookkeeper. Nothing here changes the books.
- To grant a Director the Books, use View financials in Settings → My Team; for a site’s costs, See location costs.
Common questions
I picked MTD and the Books cards show last month.
The books are by closed month, and an open month is never a headline. The caption says which month the Books lane is on.
Revenue · books and Revenue · sales disagree.
They should, a little: payout lag, processor fees, partners in arrears, cash versus accrual. The Gap column colours anything past 5% amber and past 10% red.
The Books section says no months yet.
Connect QuickBooks on Connections, or upload a P&L under Knowledge and approve its read. The first month appears after the nightly read.
Where is my cash balance?
Nowhere on purpose. Finance shows flows, never positions.
A location tab says costs are shared by grant.
Ask the owner for See location costs in My Team. Sales for that site are visible without it.
Payroll shows groups, not people.
By design. Individual pay never appears on any board.