
What this board answers
Did the schedule happen as promised, and did the people who booked turn up? Coverage, cancellations, no-shows and late cancels from the booking platform schedule, plus the studio’s Google rating. The board opens on the last 30 days against the 30 before; the tabs under the title pick another window. Fill lives on Programming and sub rate on Team; this board owns execution.
How to read it
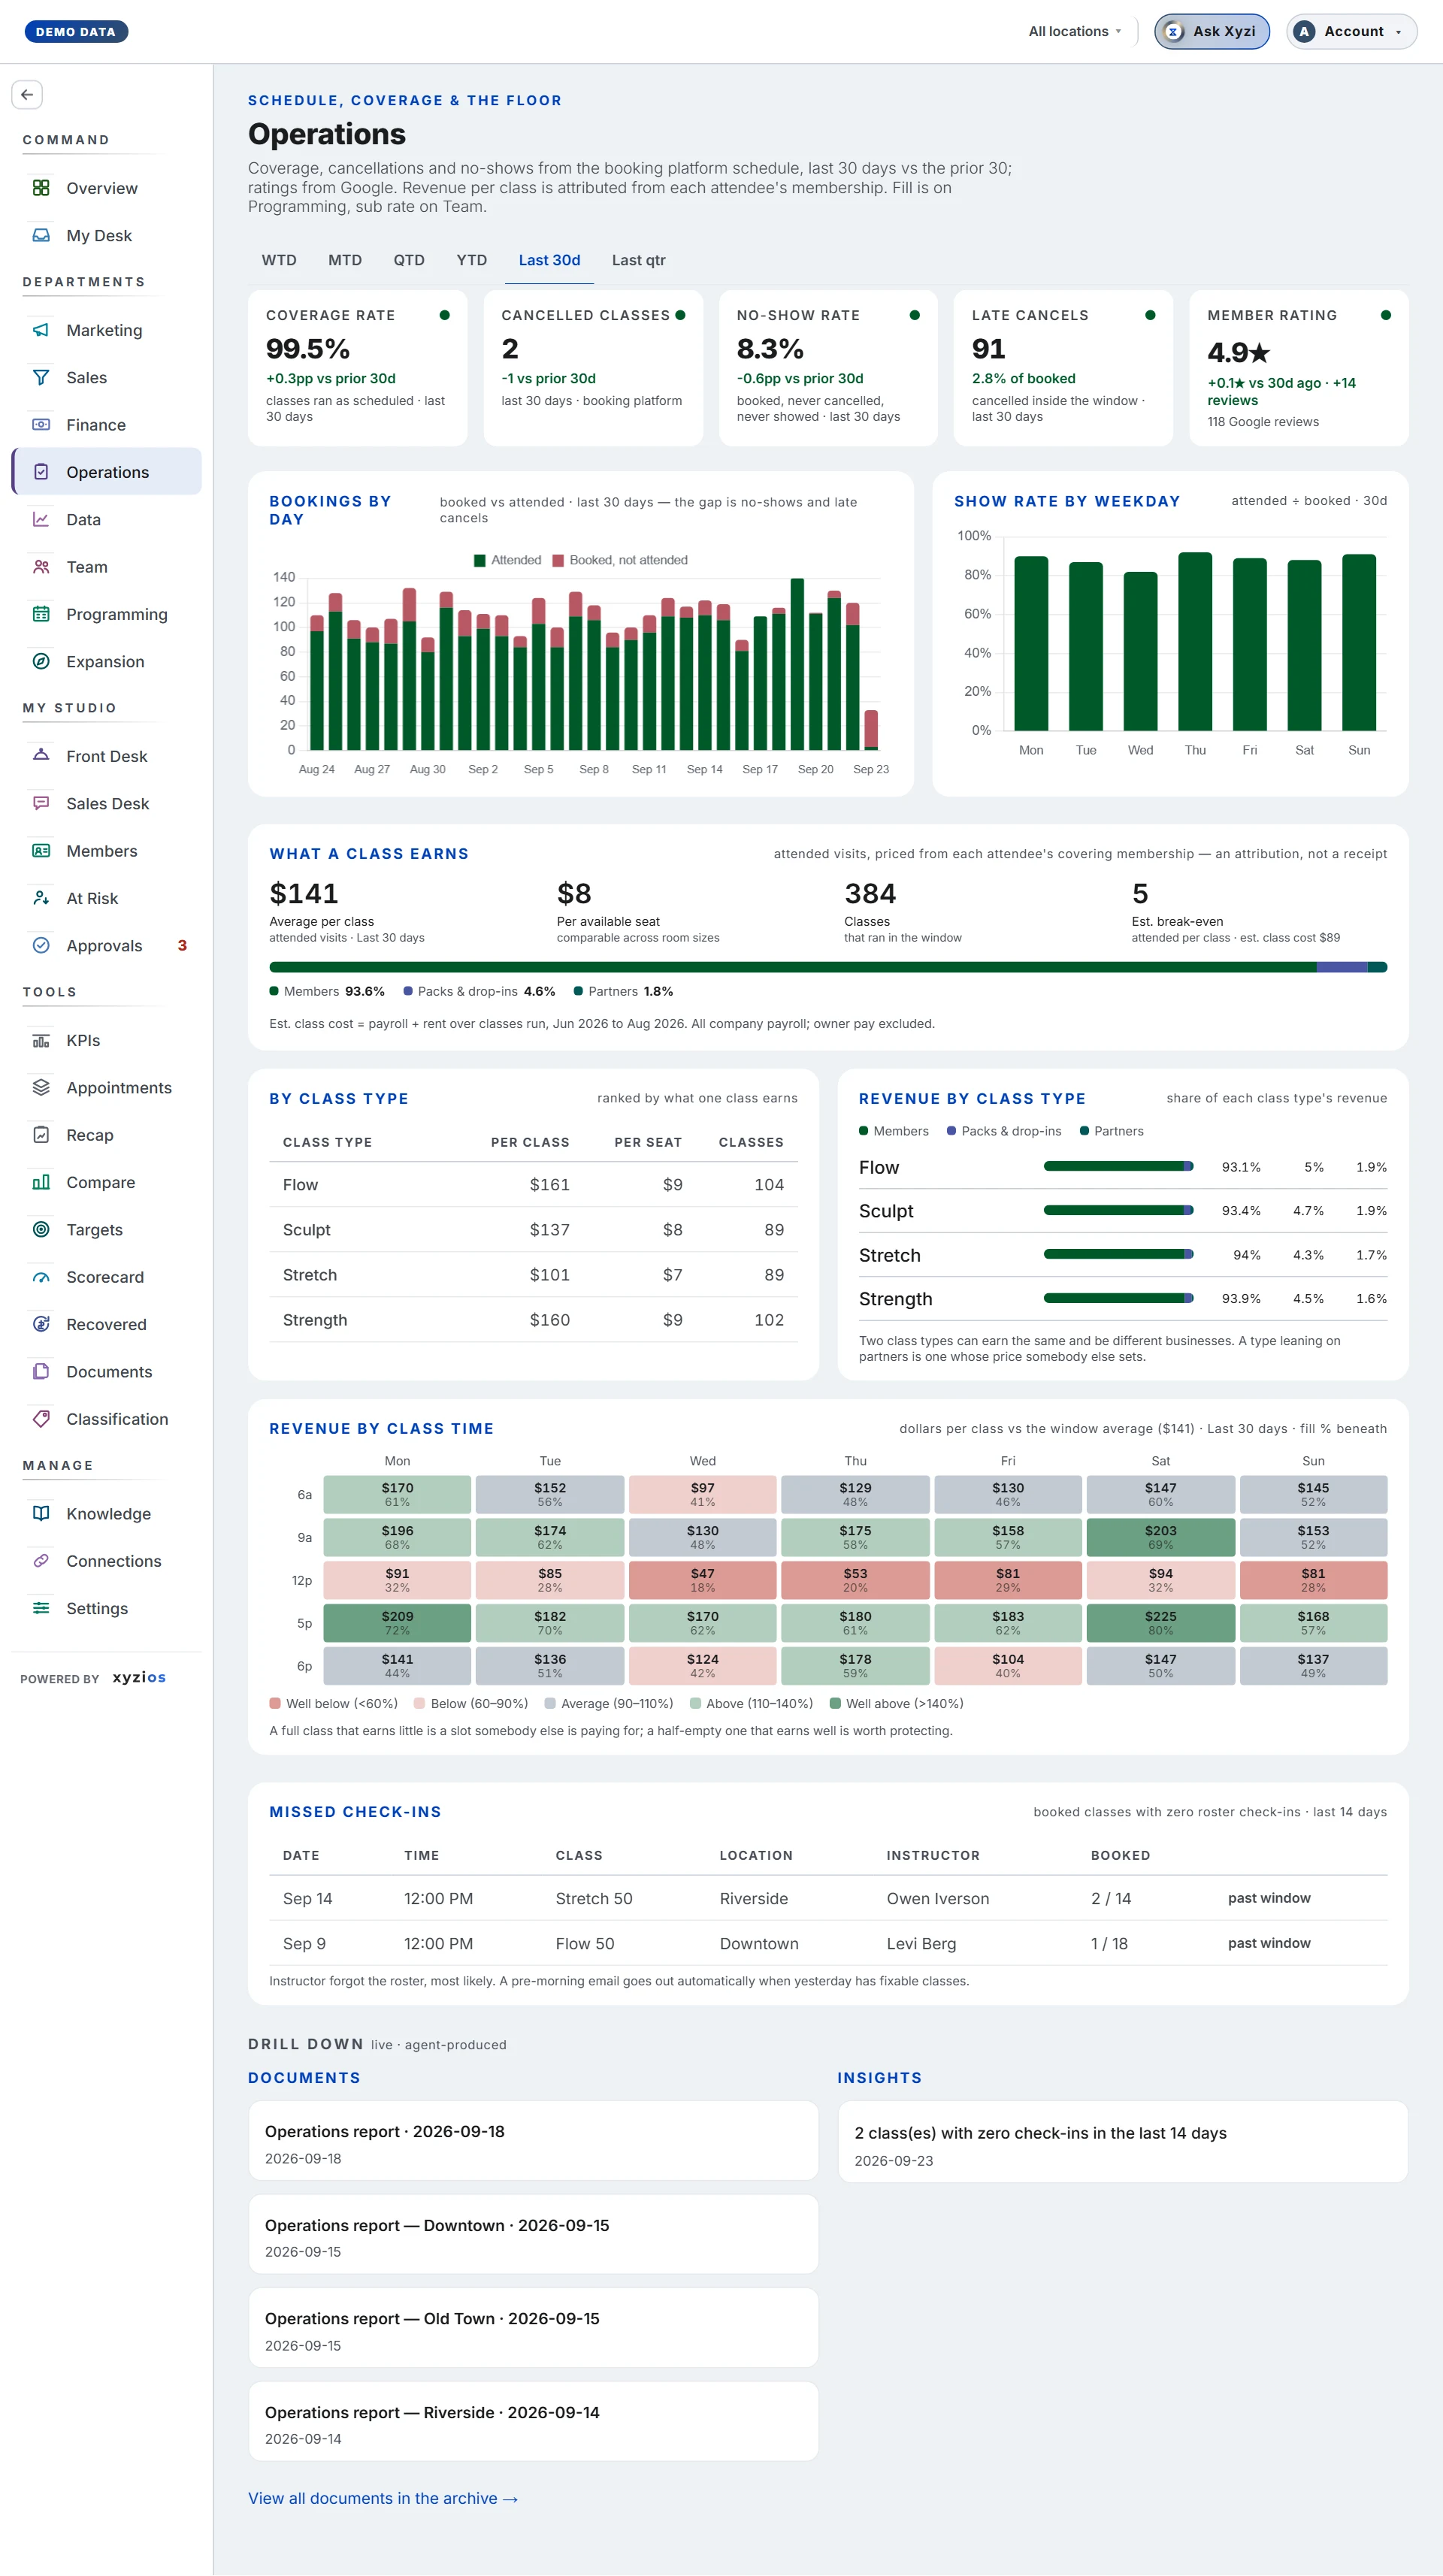
The tabs under the title set the window: WTD, MTD, QTD, YTD, Last 30d, and the closed windows the schedule can fill whole. The four schedule cards and everything under What a class earns answer for the chosen window; Bookings by day and Missed check-ins keep their own windows and say so. The trend against the prior 30 days shows on Last 30d only.
Five cards, the first four with their trend against the prior 30 days on that window. For cancellations and no-shows, down is the good direction and the arrow colours accordingly.
- 1Coverage rate: classes that ran as scheduled, as a share of what was scheduled.
- 2Cancelled classes: sessions the studio cancelled in the window.
- 3No-show rate: booked, never cancelled, never showed, as a share of bookings still live when the class started.
- 4Late cancels: cancelled inside the platform’s window, shown as a share of booked.
- 5Member rating: your Google rating and review count, with the change against 30 days ago.
6Bookings by day stacks attended against booked-but-absent for the last 30 days; the gap is your no-shows and late cancels together. Show rate by weekday beside it is attended ÷ booked by day of the week.
7What a class earns prices each attended visit from the attendee’s membership: Average per class, Per available seat (comparable across room sizes), Classes in the window and, where a partner’s rate is unknown, Visits not priced, left out rather than guessed. Revenue by class type and By class type compare formats; Revenue by class time is the same grid as the fill heatmap, in dollars, with each cell banded against the window’s own average and the window’s fill beneath it. A full class that earns little is a slot somebody else is paying for. The instructor scorecard on Team prices visits the same way and grades each teacher’s $/class against these same slot figures, so the two never read as different numbers.
With the See location costs grant the panel adds Est. break-even: the attended heads per class that cover its estimated cost. Est. class cost is payroll plus rent over classes run in the last three closed months: instructor pay where a payroll register is connected, otherwise all payroll at the site; rent only, no utilities; owner pay excluded. Where the books do not split payroll and rent by site, one company-wide figure is used and says so. With fewer than two closed months it reads Not enough data, never a number.
8Missed check-ins lists booked classes from the last 14 days with zero roster check-ins. A row marked fix now is still inside the booking platform’s 24-hour window: check the roster in there and no-show fees never hit. The most likely cause is an instructor who forgot the roster.
Pick a location and every card and panel reads for that site alone. If you manage one location you see only that site’s rows.
On a location tab, Drill down lists only the documents and insights about that site; the company’s stay on All locations.
What to do here
- Start with Missed check-ins. Anything marked fix now goes to the instructor or the desk today; a pre-morning email already goes out when yesterday has fixable classes.
- Read Coverage rate and Cancelled classes together. Coverage falling with cancellations rising is a staffing problem; take it to Team’s Fragile slots.
- Read No-show rate and Late cancels by location, then check Show rate by weekday for the day that drags the average.
- Use What a class earns when deciding which slots to keep. If partner visits are priced at an estimate, set the real rate in Studio Setup → what counts as a member.
- Tap ✦ Ask Xyzi in the top bar to ask about a number, or ◎ Report for a written summary.
Common questions
No-shows plus late cancels plus attended do not match my platform’s booked count.
Both rates divide by the bookings still live when the class started, taken from the same visit rows as the numerators, so the three reconcile with each other. The platform’s booked count is a snapshot taken at a different moment.
Member rating is a dash.
Google Business Profile is not connected, or the location’s listing has not been matched yet. Connect it on Connections.
Missed check-ins says all clear but I know a class had nobody checked in.
The list covers the last 14 days and only classes that had bookings. A class with an empty roster has nothing to check in.
Why is Visits not priced showing?
A partner such as ClassPass sent visits but its per-visit rate never reaches the booking platform. The visit is counted, the money is left out rather than invented.
Where is class fill?
On Programming. Sub rate and who covered what are on Team.