
What this board answers
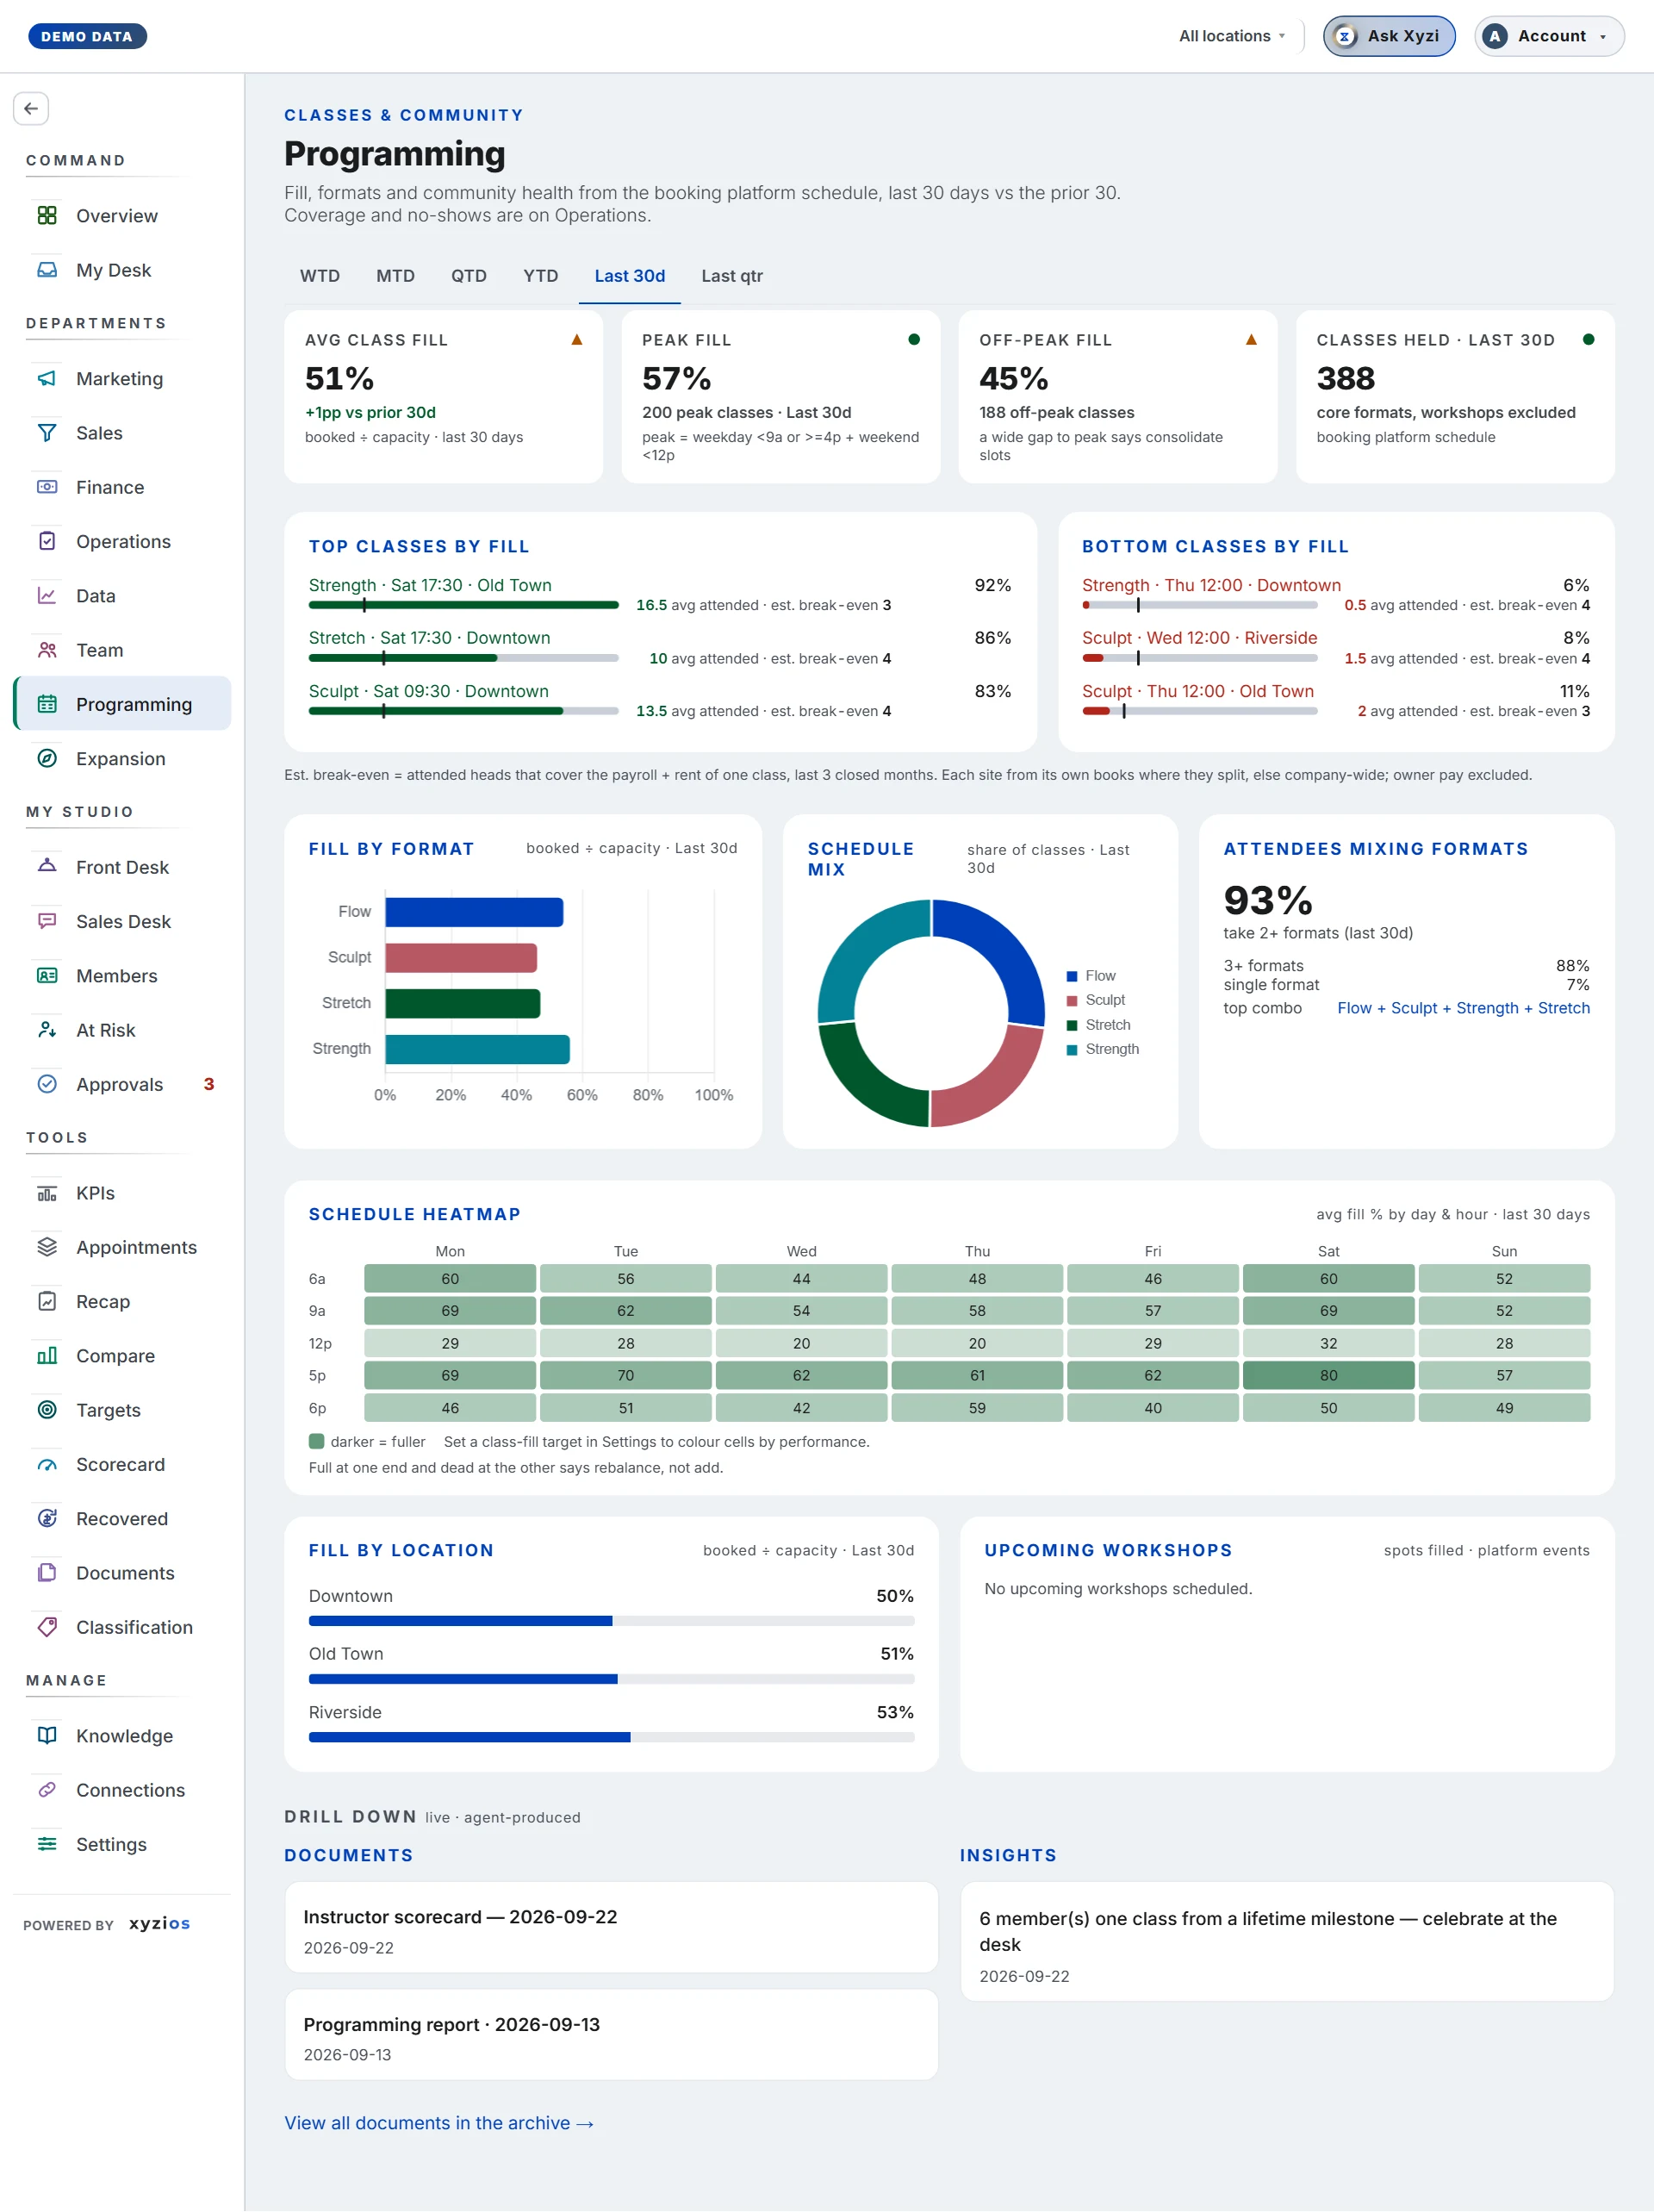
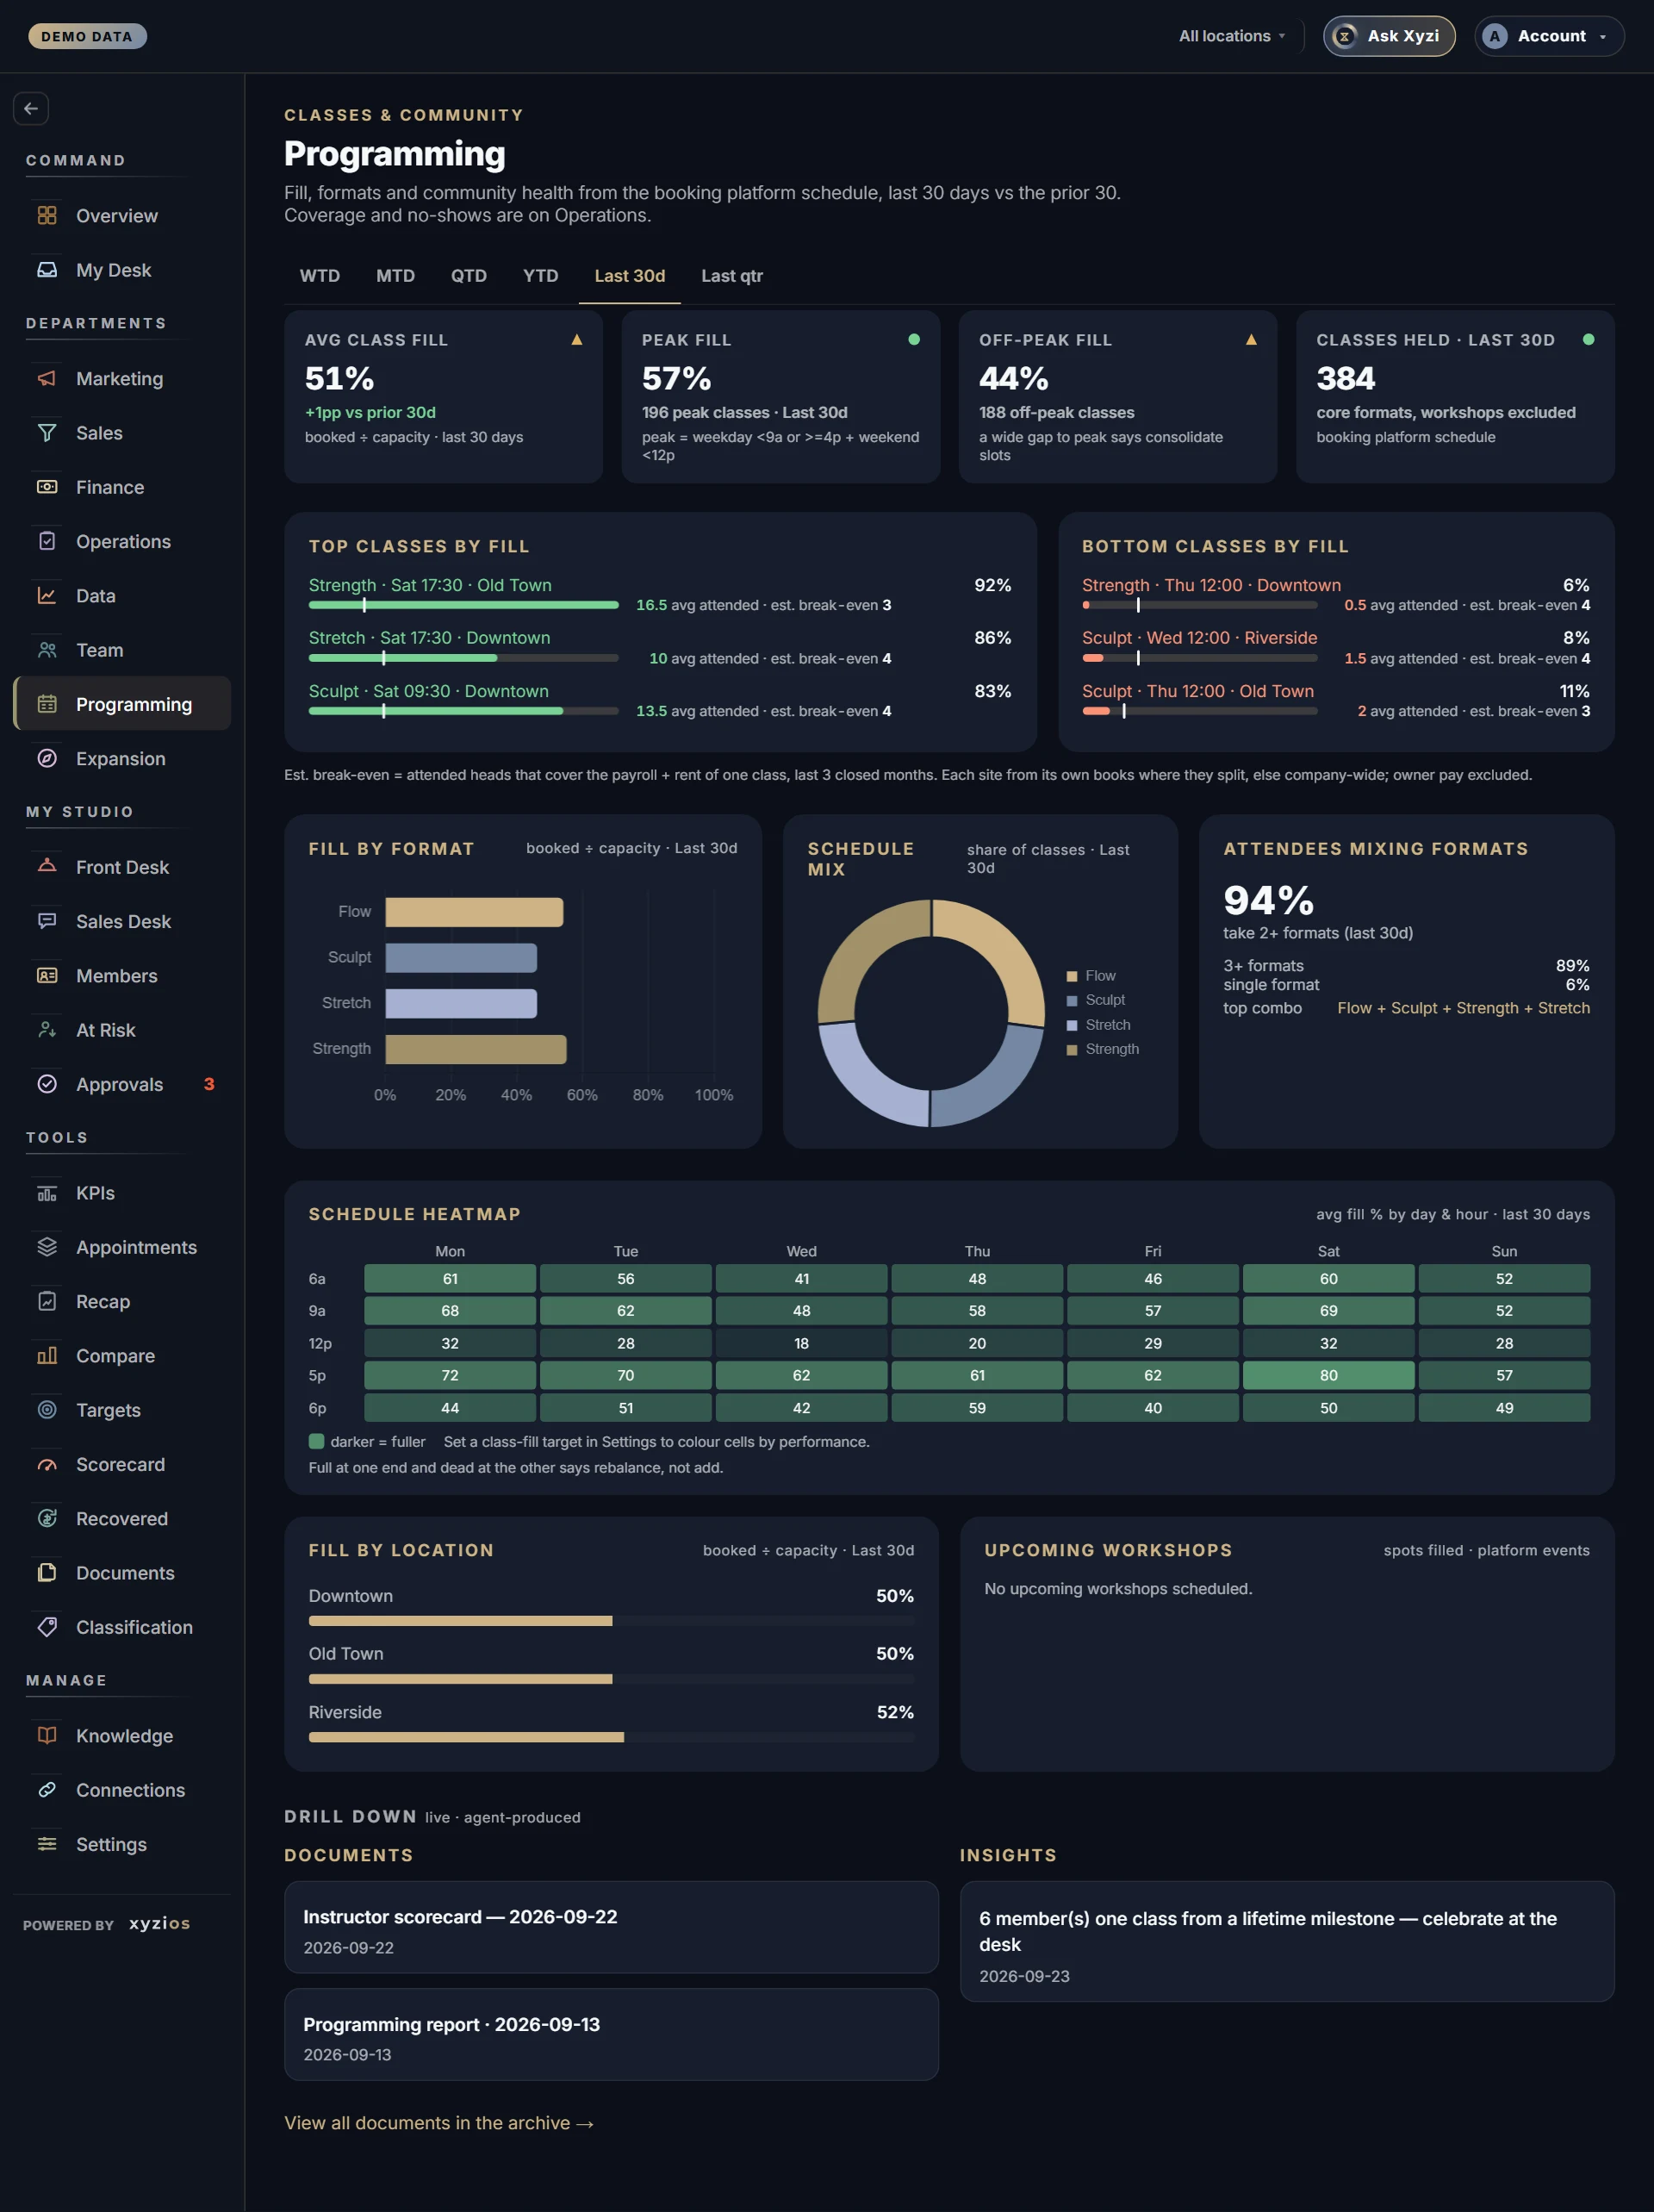
Are the right classes in the right slots? Fill, formats and community health from the booking platform schedule. The board opens on the last 30 days against the 30 before; the tabs under the title pick another window. Coverage and no-shows are on Operations; this board is about the schedule itself.
How to read it
The tabs under the title set the window: WTD, MTD, QTD, YTD, Last 30d, and the closed windows the schedule can fill whole, Last qtr and Last 12mo. Every card, list, chart and the heatmap answer for the chosen window and say so in their captions. The change against the prior 30 days shows on Last 30d only, because no other window has a prior 30 days to be measured against. Attendees mixing formats and Upcoming workshops keep their own windows and say which.
Four cards:
- 1Avg class fill: booked seats divided by capacity over the window, cancelled classes excluded, graded against the fill target you set in Settings.
- 2Peak fill: fill in peak slots, where peak means weekday before 9am or from 4pm, and weekend before noon.
- 3Off-peak fill: the rest of the schedule. A wide gap to peak says consolidate slots rather than add them.
- Classes held: core formats only, workshops excluded, over the window named on the card.
4Top classes by fill and 5Bottom classes by fill name the slot: format, day, time, location, and the fill. 6Fill by format is booked ÷ capacity per format; Schedule mix is each format’s share of classes; Attendees mixing formats is the share of attendees taking two or more formats, with the top combination. That last one is company-wide even on a location tab, because an attendee is not “at” one room.
With the See location costs grant, each Top and Bottom row carries an est. break-even line underneath: a bar for what the slot averages in attended heads, with a tick where break-even falls, the attended heads that cover one class’s payroll and rent. Every bar in the pair shares one scale. Green clears it, red falls short; a slot with many unpriced visits is not judged. The estimate is payroll plus rent over classes run in the last three closed months (owner pay excluded), divided by what an attended visit is worth in the chosen window. It counts attended heads, where fill counts booked seats. Without closed books it reads Not enough data.
7Schedule heatmap is average fill by day and hour over the chosen window; a longer window steadies the cells, a week shows one week. With a fill target set, cells are coloured on target, below target or below the alert floor, and a legend names the bands; without one, darker simply means fuller. Full at one end and dead at the other says rebalance, not add.
8Fill by location compares sites; Upcoming workshops lists platform events with spots filled, amber under 60%.
Pick a location and every card and list reads for that site, with Studio fill detail adding seats filled against capacity and the gap to target. If you manage one location you see only that site’s rows.
Sessions that are not one of your class formats, such as sauna, plunge or private training, are not counted here; they have the Custom Board.
On a location tab, Drill down lists only the documents and insights about that site; the company’s stay on All locations.
What to do here
- Set a class-fill target and alert floor in Settings. Until you do, the cards and heatmap cannot grade themselves.
- Read the heatmap for the dead hours, then Bottom classes by fill for the exact slots. Move or merge before you add.
- Read Peak fill against Off-peak fill. When peak is full and off-peak is empty, the schedule has a shape problem, not a demand problem.
- Use Attendees mixing formats when launching a format: the top combination tells you who to invite.
- Check Upcoming workshops a week out; an amber bar is a promotion to run now.
- ✦ Ask Xyzi in the top bar explains any number; ◎ Report writes the board up.
Common questions
Fill looks lower than what I see on the floor.
Fill is booked seats against capacity as the booking platform records it. If a room’s capacity is set high in the platform, fill reads low here; fix the capacity there.
The heatmap cells are all one colour.
No fill target is set. Set one in Settings and the grid grades itself into on target, below target and below the alert floor.
Why is a cancelled class not in Classes held?
Cancelled classes are excluded from every count on this board. They are counted on Operations.
My sauna or recovery sessions are missing.
They are not class formats, so they are excluded from fill on purpose. The Custom Board measures that inventory.
Why are workshops not in Classes held?
They are events, listed under Upcoming workshops, and they would distort a fill average built from regular classes.
Where is the trend for fill by location?
The bars are current; the trend against the prior 30 days is on each location’s own tab in Avg class fill, on the Last 30d window.
A tab is missing.
The schedule cannot fill it whole. Last qtr and Last 12mo appear only when every month of the window holds classes, so a studio that connected in January sees no twelve-month tab until the following January.