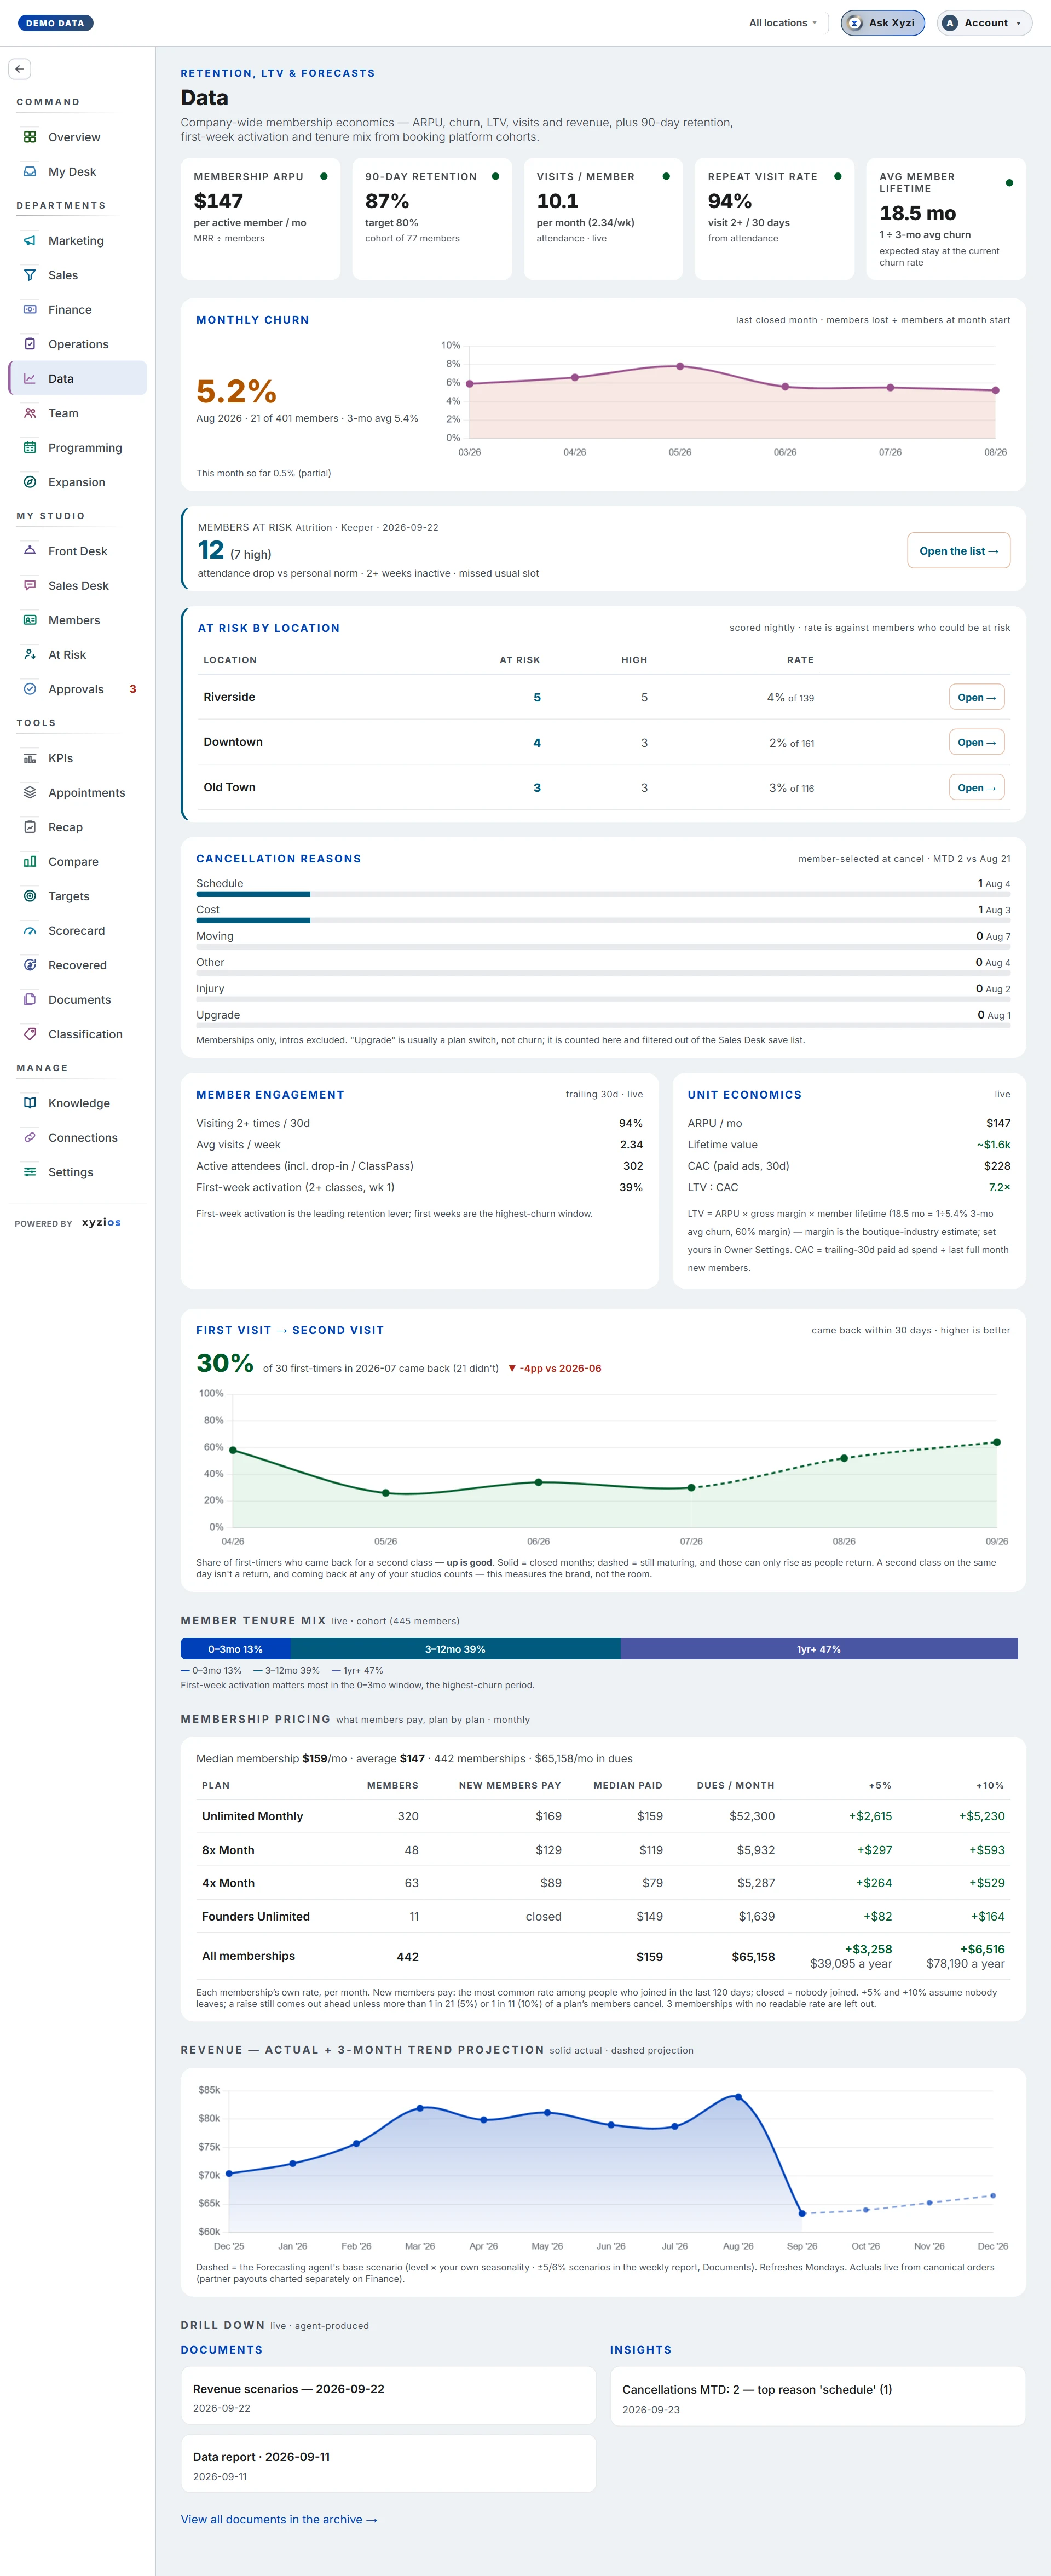

What this board answers
Do members come back, how many leave each month, and what is a member worth? It is the studio’s analyst: ARPU, churn, lifetime value, activation and tenure from the booking platform, with a revenue projection at the foot. For owners and Directors company-wide; a Location Manager gets retention for their own sites and none of the company economics, except that one holding All locations also sees the studio’s ARPU, lifetime value and engagement (visits per member, repeat visits, active attendees) on the All tab.
How to read it
The top row:
- Membership ARPU: monthly recurring revenue divided by the members paying it.
- 190-day retention: share of a cohort still members after 90 days, against a target of 80%. When no cohort is old enough it is estimated from churn and says so.
- Visits / member: per month, with the weekly figure beside it.
- Repeat visit rate: everyone who came to a class in the last 30 days, members or not, who came two or more times.
- Avg member lifetime: one divided by the three-month average churn, in months.
2Monthly churn is the last closed month: members lost divided by members at month start, with the three-month average, this month so far marked partial, and a six-month line. When some of the members lost had a fixed term that ended with no next plan, a line beneath says how many. A note says when early months were reconstructed and read slightly low.
3Members at risk is the Keeper agent’s nightly count, with how many are high risk and the top signals, less anyone who has come in or booked a class since. Open the list → opens the names. At risk by location puts the count beside a rate, so a big site is not mistaken for a bad one, and gives members with no recorded location their own row.
4Cancellation reasons is what members picked when they cancelled, this month against last. Some platforms do not share it; the panel says so.
5Member engagement (visiting 2+ times, average visits a week, active attendees including drop-ins and ClassPass, first-week activation) sits beside 6Unit economics (ARPU, lifetime value, CAC from paid ads, LTV : CAC). 7First visit → second visit is the share of first-timers who returned within 30 days; solid months are closed, dashed are still maturing and can only rise. 8Client retention, under it, is every client who came to a class in the last 30 days and the share who came on two or more days, with a line of the last six calendar months (this month dashed while it fills in) and the change against the 30 days before. Members, pack and drop-in clients and intros all count, each once however often they came, and two classes on one day are one day; partner visits are left out, since one partner account can book for many people, and so are staff taking a class. On a location tab it counts the days at that location. Member tenure mix splits current members into 0–3 months, 3–12 months and a year or more.
Membership pricing, just above the revenue chart, is what members pay, plan by plan, per month. Five plans show, up to ten with Show top 10, and the rest roll into Other plans, so the dues add up to All memberships: its dues are the studio’s recurring revenue and its average is the ARPU card. Members are people: someone paying for two plans is counted under each plan and once in All memberships. New members pay is the most common rate among people who joined in the last 120 days (closed means nobody joined; a dash means too few joined to call it). +5% and +10% are what a raise would add a month, assuming nobody leaves.
9What a visit is worth, under it, is plan by plan over the last 30 days, one line a plan: the bar is the price of one visit, the tick on every bar the average across all visits, and beside it the price, the plan’s share of all visits and how many visits each of its clients made. For a membership plan the price is the plan’s monthly dues divided by the visits its members made, so a member who did not come still counts: a bar well past the tick is a plan its members barely use, and one well short of it a plan priced below its use. The eight lines with the most visits show, the rest behind Show all. The six membership plans with the most members have lines of their own, the rest one line as Other plans, then one line for everyone else (packs, drop-ins, intros and passes paid in full), valued as What a class earns values them, and a line per partner at its rate per check-in. A partner booking on one shared account has no visits a client. A plan with no visits in the 30 days is left off and counted in the note. Visits on a comp product, and staff taking a class, are left out. It is on the company view only.
10Revenue — actual + 3-month trend projection draws actuals solid and the Forecasting agent’s base scenario dashed; it refreshes on Mondays.
On a location tab, cohorts and cancellations follow the purchase location and engagement follows the class location; the projection, LTV and CAC stay on the company view. If you manage one location you see only that site’s rows.
On a location tab, Drill down lists only the documents and insights about that site; the company’s stay on All locations.
What to do here
- Read Monthly churn first, then Cancellation reasons for why. “Upgrade” is usually a plan switch, not a loss.
- Tap Open the list → under Members at risk and work it on the Retention board: press Handled once someone has reached a member, or Assign to give the call to someone as a task. Saves the Keeper agent proposes wait in Approvals.
- Watch First-week activation. First weeks are the highest-churn window; a low figure here shows up in churn three months later.
- Use First visit → second visit closed months only when judging a change; the current month is not finished.
- Set your gross margin in Settings if the LTV note says it is using the industry estimate.
- ✦ Ask Xyzi in the top bar explains any figure.
Common questions
New members pay shows a dash.
One or two people joined that plan in the window, and three are needed to call a going rate. closed means nobody joined.
Churn shows the previous month, not this month.
A month-to-date churn reads near zero on the 2nd of every month. The last closed month is comparable; this month so far is shown beneath as partial.
My location’s retention cohort is smaller than its member count.
Cohorts key on where the membership was bought; engagement keys on where classes were taken. A member who bought elsewhere and attends here counts in engagement but not in the cohort.
What is “Location not recorded” under At risk by location?
Members whose home location the platform never set. They are on no site’s tab, so they get a row here rather than disappearing.
Why is the projection dashed?
It is a forecast, not a fact. Until the Forecasting agent has run, it is a simple three-month trend.
Why does 90-day retention say “est. from churn”?
No cohort has aged 90 days yet. The estimate is replaced by a measured cohort as soon as one exists.